
One great aspect of the Metis data science program is its emphasis on contextualizing learned materials with projects. These projects start the first week, and are a great way to force introduction to the fundamental languages and tools used in data science. Rather than just learning programming languages like Python or data manipulation suites like Pandas in lectures, Metis students have to learn how to apply these tools to real world data in a simulacrum of a data science contract.
The first project in the Metis repertoire involves analyzing publicly available data from New York City’s Metropolitan Transit Authority. Since 2010, as part of their open data initiative, the MTA has provided logs of entry and exit audits for all light rail stations in the city. Because of this dataset’s organization, volume, and public availability, Metis has chosen it as a basis for its introductory project, code named ‘Benson’.
In project Benson, we are asked by a hypothetical client to utilize a data science driven approach to help them better target the efforts of their street teams, who collect signatures and find new members at subway station entrances. From the client email:
WomenTechWomenYes (WTWY) has an annual gala at the beginning of the summer each year. As we are new and inclusive organization, we try to do double duty with the gala both to fill our event space with individuals passionate about increasing the participation of women in technology, and to concurrently build awareness and reach. To this end we place street teams at entrances to subway stations. The street teams collect email addresses and those who sign up are sent free tickets to our gala. Where we’d like to solicit your engagement is to use MTA subway data, which as I’m sure you know is available freely from the city, to help us optimize the placement of our street teams, such that we can gather the most signatures, ideally from those who will attend the gala and contribute to our cause.
Our fictitious client, WTWY, has street teams they are sending out to collect signatures and find attendees for their annual gala. Instead of picking stations and times at random or based on gut instinct, WTWY is enlisting a data scientist to help them target the stations as which they can expect the most results.
The fundamental basis for this analysis is MTA data, which provides the number of entries and exits as each MTA turnstile in four hour increments. At first glance, this data is enough to provide a data driven solution to the problem: target the stations with the highest levels of footfall! However, at busy stations, the flux of commuter traffic will almost always be higher than the number of recruiters WTWY will be able to provide. In other words, WTWY will really see no difference between a station with 10k entries per hour and 100k entries per hour; in each case, there will be more than enough potential gala attendees to try to convince. As such, we decided to initially cut the number of potential target stations to the top 50:

Locations of top 50 subway stations in NYC by footfall traffic between the months of March and May (people/day). Larger circles correspond to busier stations. Source: MTA.info
With footfall data only, one might reach the conclusion: “go to Penn Station or Grand Central Station, you’ll find lots of people there”. However, we can try to add in a secondary data set to try and further help WTWY better reach their target audience. One of the clients stated goals is to recruit donors for their annual gala. Perhaps we can target stations where the commuters are more likely to be wealthy enough to donate to WTWY? In order to make an estimation of this, we retrieved U.S. census data on mean household income:

Household income in the greater NYC metro area ($/year). Source: US Census Bureau
At this point, we have two disparate data sets. One describes the number of footfalls per day, georeferenced subway station locations. The other describes household income per year, NOT georeferenced to subway stations. In order to integrate these two sets, we first need to map the income to each subway station. We do this using an nearest neighbors algorithm. Once we have this ‘mapped income’ at each station, we need to define a system by which we can combine station footfalls (people/day) and income ($/year) in order to rank our 50 stations of choice. We chose to do this using a linear combination:
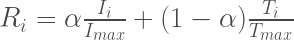
Here, 


Top 50 stations in New York with our suggested ranking. Large (red) circles have both large footfalls and high associated household incomes, and are preferred over small (blue) circles which have either lower household incomes, lower foot traffic, or both.
As can be seen, we recommend that most of the stations that WTWY target should be in Manhattan, and often correspond to stations we extremely large footfalls. However, there are several stations in the outer boroughs and New Jersey that are both high footfall AND high income, and could potentially be targeted to reach a gala audience that would otherwise be missed by staying in central location within the city.
